
The Mid-Cycle Shakeout: Buying the Dip in Top-Tier Royalties
Why a 30% correction is historically healthy for a long-term bull market—and how we are exploiting the panic to upgrade portfolio quality.

Mining Stock Monkey VIP
Investment Memo #135
July 5, 2026
The Reality of a 30% Drawdown
Since reaching its highs five months ago in late January 2026, the gold price has fallen significantly. If we take the intraday high of $5,598 back in January and the intraday low of $3,925 during Thursday of last week, the peak-to-trough pullback was about 30%.
This decline has had a brutal effect on many of the companies in our portfolio and precious metals stocks in general. While the gold price peaked in late January, most stocks didn’t reach their highs until early March after strong Q4 earnings started rolling in.
As of this week, nearly all of the top companies in the sector are down 30% or more from their peaks. To give a few examples, here is the recent performance of some of the most popular and highest-quality companies in the sector:
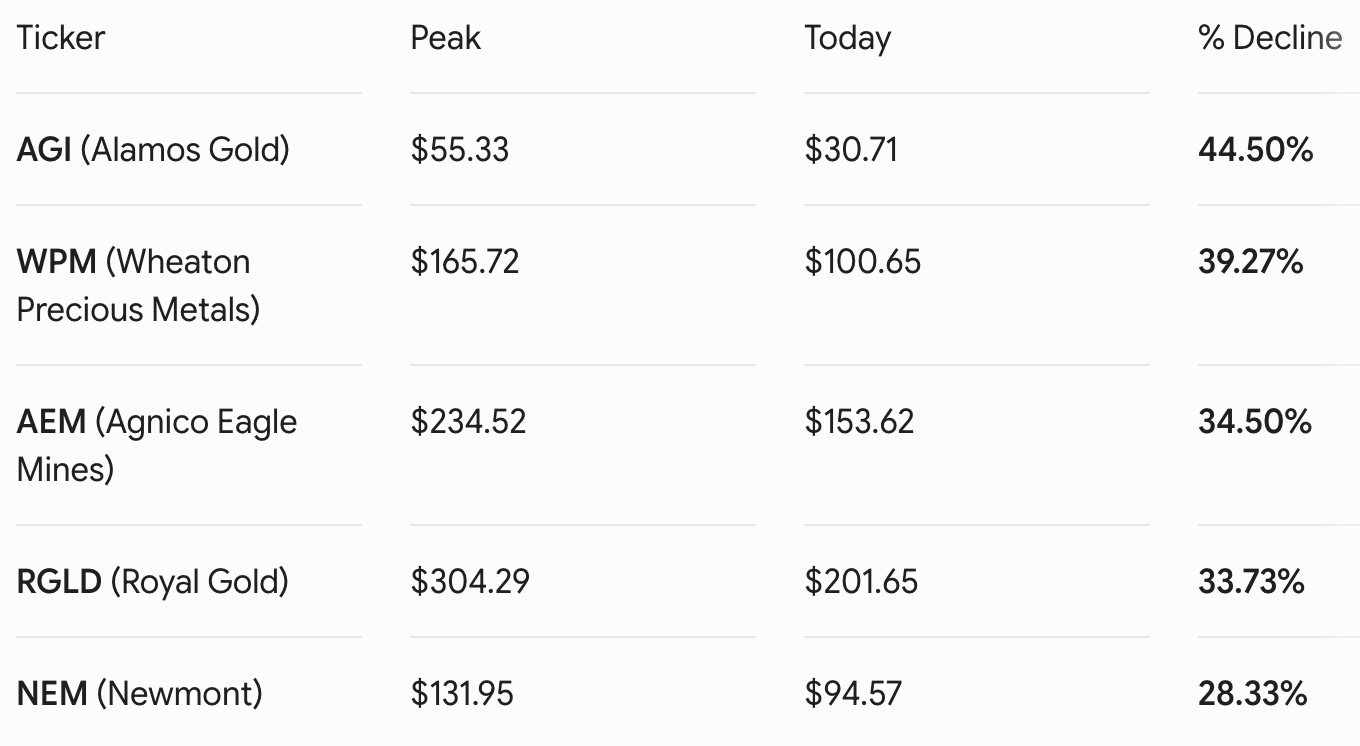
The Royalty Pricing Error
Something worth noting is that some of the top-tier royalty and streaming companies sold off just as aggressively as producers during this flush. This does not make mathematical sense and creates a buying opportunity for us.
When the gold price drops by roughly 30%, a producer’s operating margins fall precipitously, whereas a royalty or streaming company’s margins remain virtually untouched.
To see this math in action, let’s look at a major producer operating at an AISC of $1,700 per ounce, compared against a typical streaming business model
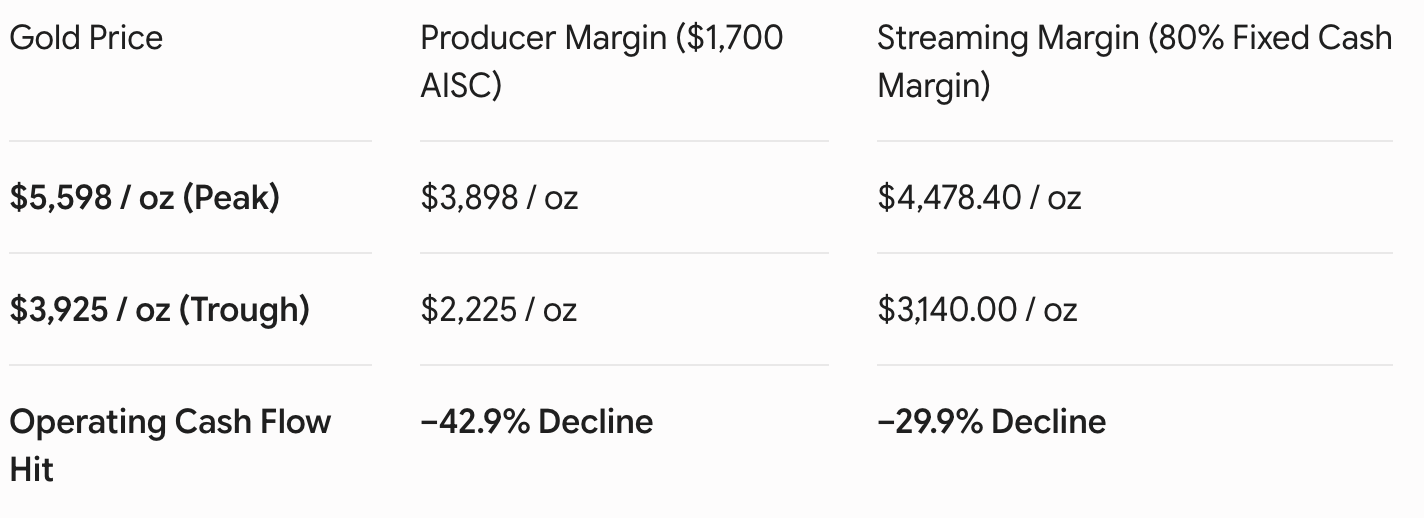
Because a miner faces heavy structural fixed costs (labor, diesel, power, equipment maintenance, replacement parts, etc.) that do not decrease just because the metal price fell, a 29.89% drop in the spot price hits their bottom line with reverse operational leverage. In this scenario, the producer’s cash generation slumps by nearly 43%.
Conversely, the streaming company typically has margins that are contractually fixed (often at 80%). Because their contract dictates a fixed percentage or a flat ongoing transfer price, their high cash margins stay essentially flat regardless of the macro environment. Their cash flow only drops in a strict 1-to-1 linear fashion with the gold price—down exactly 29.89% to match the metal.
Lumping these two business models together during a market sell-off makes no sense. It creates a valuation disconnect and makes the royalty and streaming companies even more attractive at these levels relative to most producers.
One could maybe argue, “Oh, it’s because the price of crude oil has fallen hard, therefore the producer margins will benefit from lower energy prices.”
While this is true to an extent, energy typically only makes up about 10% of a miner’s overall cost structure. When 10% of their costs fall by 30%, their overall costs drop by a mere 3%. A falling oil price simply doesn’t have a large enough effect to offset the cash generation hit from a lower gold price.
The market has thrown the babies out with the bathwater here.
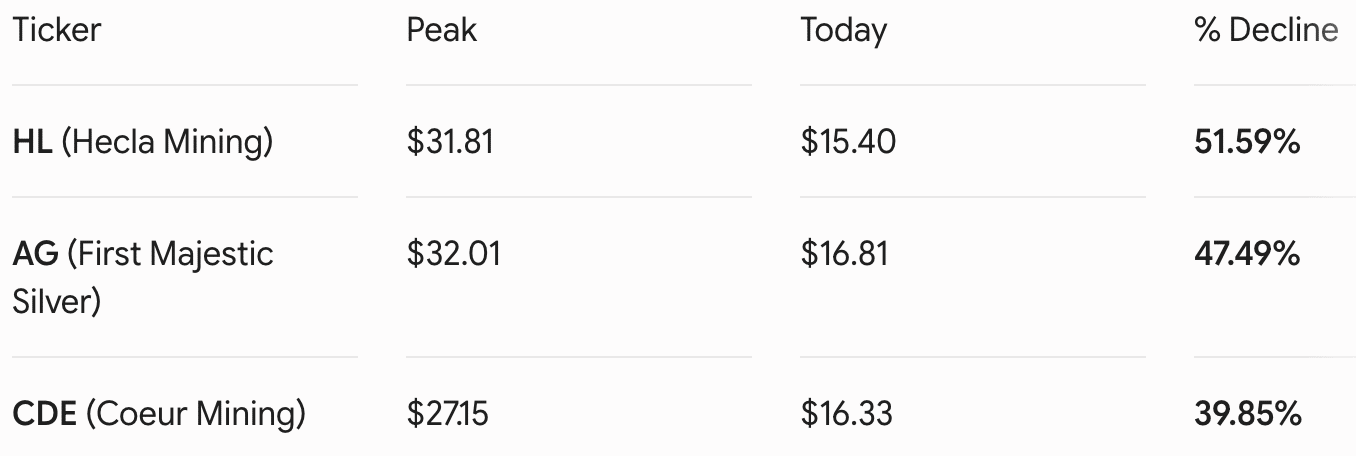
If we look at silver stocks, the fall is even more pronounced, with many of them performing significantly worse than the gold stocks listed above:
The Historical Context: Is This Normal?
At the beginning of 2024, gold was hovering right around $2,000 per ounce. Since then, we have witnessed a historic bull run with gold moving up to a high of nearly $5,600 over the next two years.
When looking at past gold bull markets, it has been the norm to see multiple pullbacks of 15%, 25%, and even 35% over the course of a 10-year secular run. In fact, in the mid-1970s, there was a massive 49% pullback before the gold price eventually went from ~$100 to $850 per ounce.
Anyone who got scared out during that drop from $200 down to $100 missed the epic run to $850. If you believe in the underlying thesis, it is critical to “stay the trade” during these sharp, violent pullbacks.
Risk Management: What if the Top is In?
While a 30% decline is historically normal within a bull market, as disciplined investors, we have to ask the hard question: Could we have seen the highs already?
There is no guarantee that the January peak wasn’t the top. After all, at the end of every bull market comes a decline that quietly masks itself as the start of the next bear market. We are currently 10.5 years into this bull market since the 2015 lows.
After the historic run we’ve seen since early 2024, it is entirely possible that we enter a 6-to-24 month period of consolidation where the metal trades sideways or slightly down from here. We are already five months into that correction.
The Macro Reality
Although this bull market is mature compared to the length of past gold bull markets, my gut tells me the bull run is far from over.
Even if gold doesn’t move north in the short term, the macroeconomic fundamentals remain unchanged. Governments around the world will continue increasing the money supply because it is the most politically expedient way to get elected. Politicians promise things governments can’t reasonably afford, and they pay for that “free” stuff by making each dollar, euro, or peso worth less.
As the supply of fiat currency increases, my guess is that the gold price will at least keep pace with that monetary expansion in the long run. If I am right, the long-term structural trend for gold remains decidedly up.
I am viewing this 30% pullback strictly as a buying opportunity. I keep adding to my positions, and below is exactly what I have been buying.
